Xerox to Acquire Lexmark
Transaction between printing industry icons is expected to close in second half of 2025.
Tailored Digital Transformation Solutions
You want to conquer your business challenges, improve your customer experience, and protect your data. But today, you face challenges specific to your industry: evolving regulations, rising costs, increasing competition, and cyber threats.
That’s where we come in. Xerox has the technology, industry expertise, and tailored solutions to empower organizations across multiple sectors, including education, legal, and insurance to achieve their business goals. Whether you need to digitize your documents, automate workflows, optimize your print environment, or secure your network, we have you covered.
Full Speed Ahead: Xerox and Aston Martin Aramco Formula One® Team


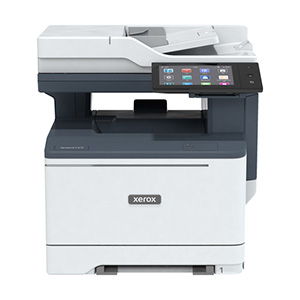
Shop Xerox Printers and Supplies
Save up to $230 on print options for home and office, plus get free shipping on supplies.
Future-Ready IT Solutions: Xerox and ITsavvy’s Combined Expertise at Your Service
We’re expanding our IT Services across the United States, Canada, and the United Kingdom to help you solve today’s workplace challenges with the ability to flex to future needs and requirements. Let's simplify how you can harness emerging technologies like Generative AI, implement robust cybersecurity protections, and make meaningful progress on digital transformation.

What can we help you with?

Xerox's Commitment to Preserving Our Planet
We strive to maintain the highest standards for preserving our environment and enhancing the health and safety of our employees and communities.
Xerox at a Glance

About Xerox
Our industry-leading technologies, expertise, innovations and global reach allow us to deliver exceptional solutions to our customers.

Innovation and Awards
View the Xerox history timeline highlighting business innovation, research and design, cutting edge technology and rich brand history.

Insights and Case Studies
Explore our collection of case studies, with use cases of Xerox services and solutions for small business, enterprise businesses, education, and more.

Security Solutions
Security is critical to every business. Learn how to protect valuable information & documents with Xerox’s data security solutions.
From digitizing documents to managing complex data, and everything in between.


